Gantt chart
The Gantt chart is commonly used in project management. It is used to visually represent the status of different activities (tasks) which make up the project. The diagram’s left column lists all the tasks, while the header line represents the most suitable time line for the project (days, weeks, months, etc.). Each task is indicated by a horizontal bar whose position and length are the start date, duration and end date. This diagram allows you to view in a glance:
- The different tasks to consider,
- The start date and end date for each task,
- The expected duration of each task,
- The possible overlapping of work, and the duration of this overlap,
- The start date and end date of the project as a whole.
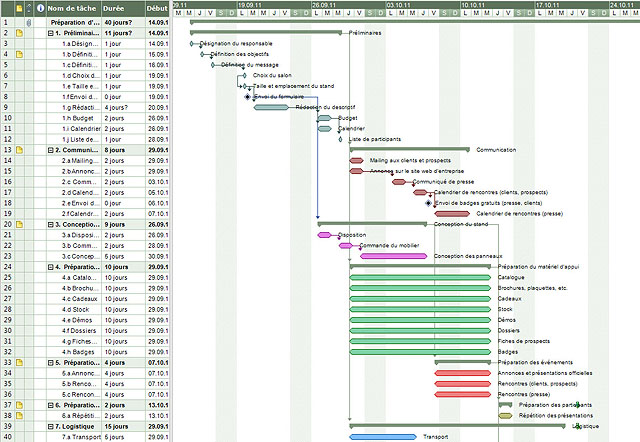
A Gantt chart lists all the tasks required to carry out the project, and the date at which these tasks must be performed (the schedule). It serves to model the tasks necessary for the implementation of a project and to monitor them. What makes the interest of this diagram is that it is possible to represent the dependencies between tasks, the degree of fulfillment of each task at any time, resources involved and so on.
There are many software programs available to make a Gantt chart.
For example, Marense offers free software and free you can download from the link: Ganttproject
For any question, do not hesitate to contact us !